Interactive Annual Reports - Bring your content to life
Interactive Annual Reports - Bring your content to life

The time of year is upon us where you might be starting to plan your annual report.
These reports take a lot of time, effort and expense to compile and then on top of that, there are generally printing and transport costs to distribute the documents to shareholders.
Not only is the annual report a document that presents your company financials and fulfils requirements, it is also a tool for showcasing your achievements and portraying a certain look and feel for the company. It is therefore an important tool for showing your stakeholders and the public what the company is about.
Traditionally the annual reports have been glossy, multi page documents, printed on specialist paper and distributed far and wide. Now, more and more companies are opting for interactive versions of annual reports, with either a very simple accompanying printed document, or a document that the viewer can download from the annual report website.
Whether they are doing this for environmental reasons, company or governmental directives, there is no denying that an interactive annual report has many benefits including:
- Being accessible to more people, on a range of devices.
- Having varying levels of interactivity, starting with simple animations and galleries to a more complex display of data, video or interactive elements.
- Having a deeper and more varied level of engagement where a viewer can explore the content in more detail through related links, panels with additional content or complex data tables, or get a quick overview via visuals, animations and video.
- Having a responsive version where the content adapts to desktop, tablet or mobile devices.
- Having iPad versions available through Apple's AppStore.
- Having mobile versions displaying a summary of data or reduced content.
- Having a video summary from the CEO, or members of the leadership team, welcoming the viewer and summarising the results and successes of the past year.
Below are some examples of effective interactive annual reports, all with a slightly different flavour and depth of information.
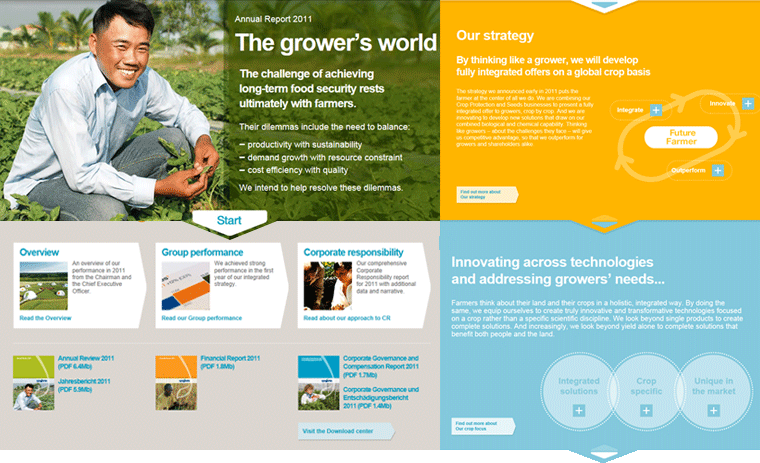
Syngenta
What looks to be a one page website at first glance offers a wealth of information spanning multiple pages. The content of the initial page is well laid out and very visual, with many rollover elements and a great summary inviting the viewer to explore further content.
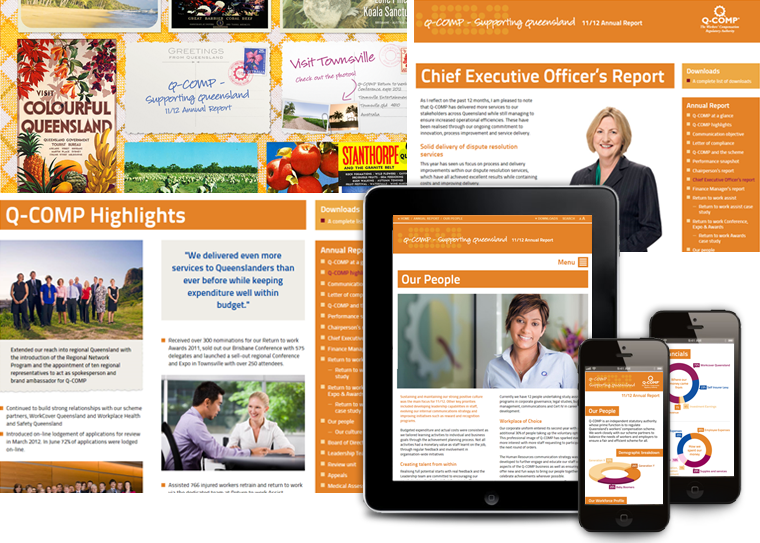
Q-COMP
A local company with an innovative approach, the Q-COMP annual report is responsive and adaptive to different device sizes. On desktop all the content is presented, on tablet, there is a full screen option with a hidden nav and on mobile, the data is presented with graphs and visuals, much like an infographic for quick viewing.
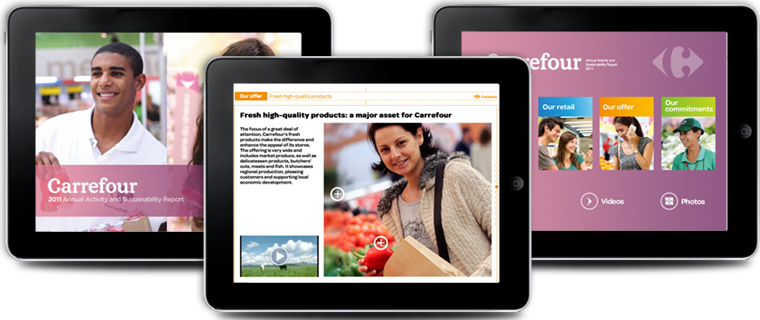
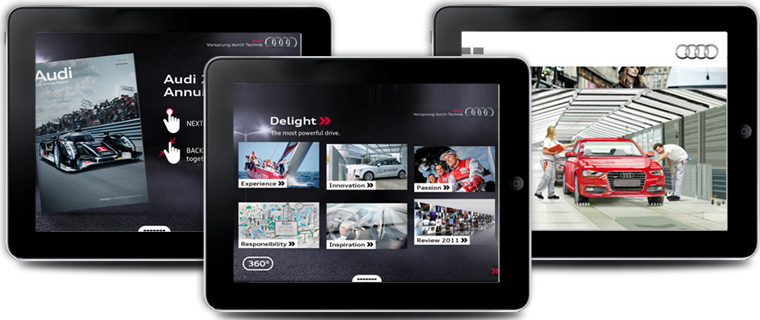
iPad Annual Reports
Both of these reports from Carrefour and Audi are created for iPad and available through the App Store. These contain and iPad specific layout and many interactive elements specially created for touch. These also include videos and great visuals to really bring life to content and engage the viewer.
Thomson Reuters
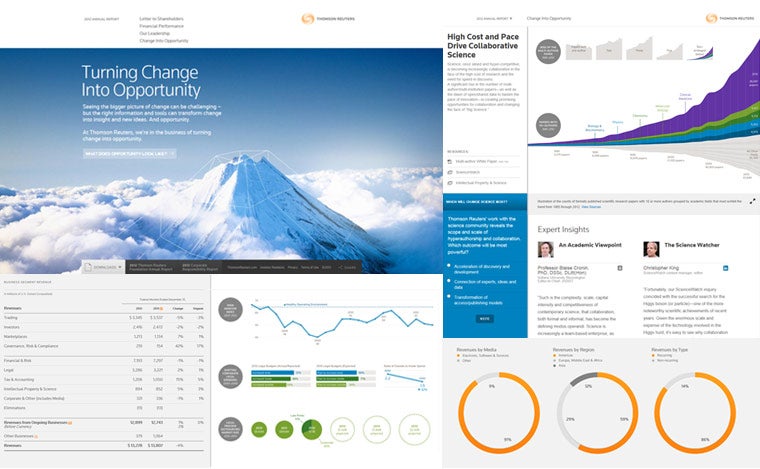
Beautiful, full screen visuals strike the viewer when they get to the annual report. This is then supported by a site structure that has a depth of content that is simply presented, with easy to understand graphs and data tables. If the viewer wants more, there are many pages of complex visuals, expert insights, polls and additional information available to explore giving a very comprehensive, yet easy to understand document.
Delphi
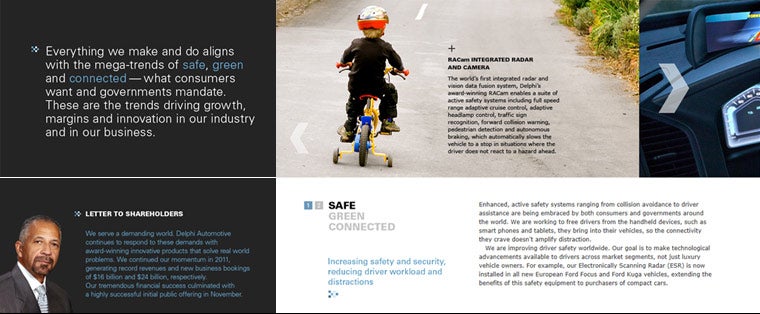
Like reading the printed version of the annual report, this online version is a no fuss, yet beautifully designed document, really giving a feel for the company.
United Technologies
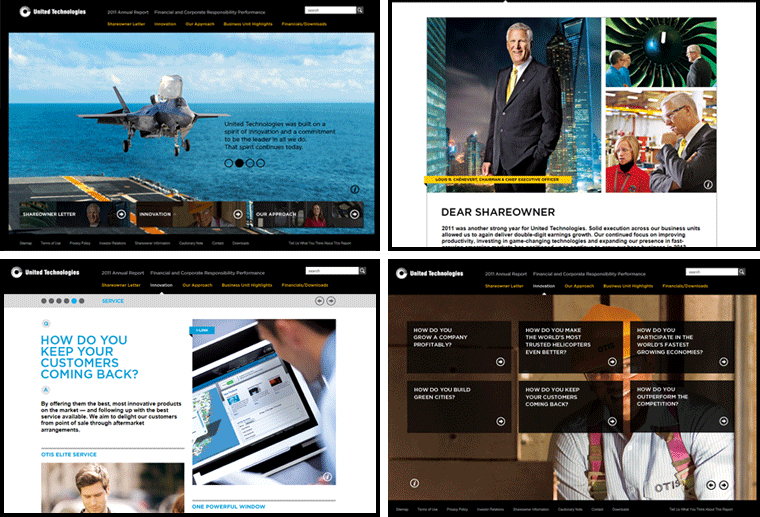
Very visual, with bold graphics and well laid out content. This layout would also work well on the iPad without the need for a separate application.
As you can see, there are many styles and options for displaying content; whether it's a brief summary of data or a multi-page interactive online tool. So why not make this year's report interactive - bringing your content to life and making it accessible to all.

